Executive Summary
The Predictability of Chaos
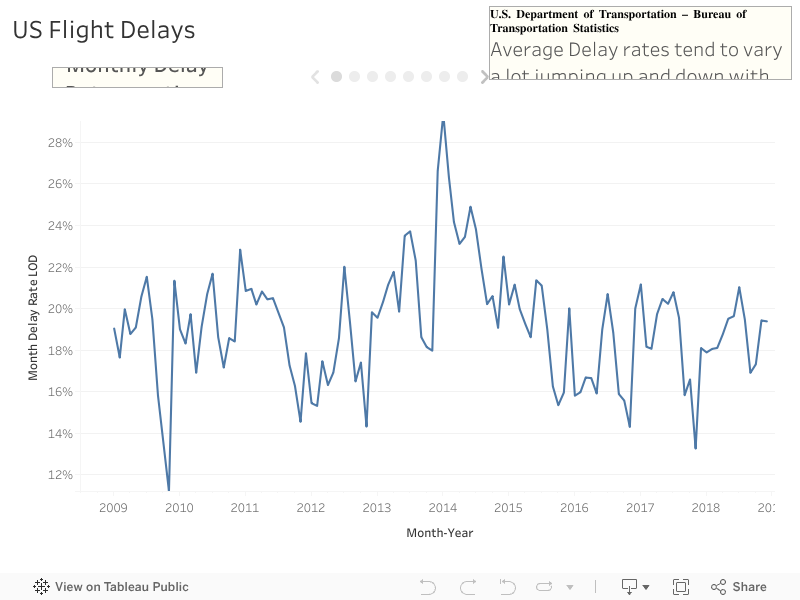
While delays seem random, they are highly predictable. Fluctuations typically stay within 10-30% of flight volume, and forecast models show high confidence. The analysis confirms that seasonal delay rates consistently stay within 1 standard deviation of their historical averages.
Design Approach
Confidence Bands (LOD): Dotted reference lines indicate seasonal norms (1 std dev).
Connected Trails: Airline performance is visualized as trails flowing from bottom (2009) to top (2018), with better performers (low delay) floating to the top.
Key Insights
- Time of Day: Delays spike at the start and end of the day. Mid-year (summer) exacerbates these late-day operational fatigues.
- Traffic ≠ Delay: High-traffic airports do not correlate with higher delay rates; volume is managed effectively.
- Airline Strategy: Cancellation is a deliberate choice, not just a result of delay. Delta and Spirit show unique improvement trends over the decade.
BTS On-Time Performance (2009–2018).
Limitations: Covers domestic non-stop flights only. Excludes small regional carriers (<0.5% revenue). Treats all flights equally (a 50-seat jet counts the same as a 300-seat widebody), meaning passenger impact is approximated.
Heatmaps reveal the "dark" start and end of operational days.
Connected Scatterplots show the 10-year trajectory of airlines.
LOD Calculations normalize seasonality to show true performance deviations.
Cancellation rates and delay rates are loosely correlated, suggesting that whether a flight gets cancelled is often a strategic decision to protect the network, rather than a direct result of delay duration.