Executive Summary
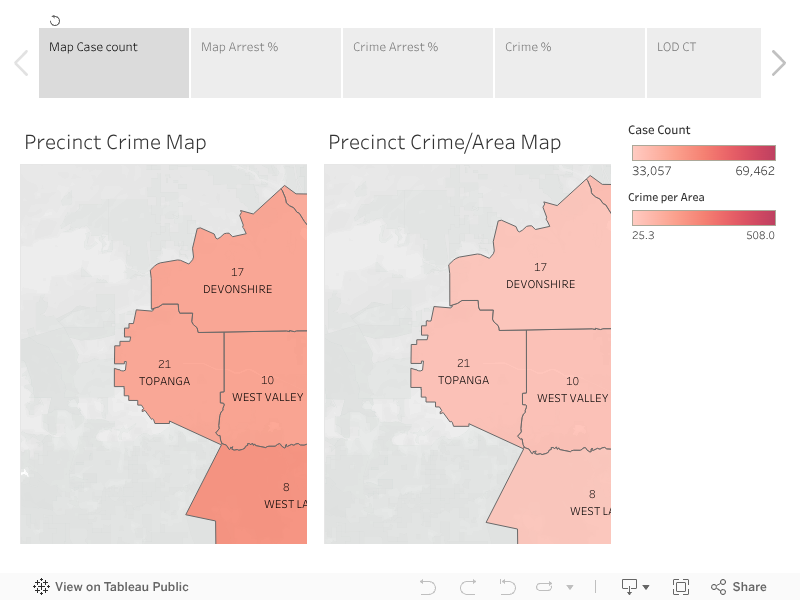
Volume vs. Density
Raw case counts suggest large precincts like 77th Street are the most dangerous. However, normalizing for land area reveals
Central Precinct
as the true density hotspot. The analysis also uncovers a disconnect between crime volume and arrest efficiency in these high-density zones.
Design Approach
LOD Expressions for Independence Testing:
We used Level of Detail (LOD) reference lines to calculate "expected" victimization rates if crime type and descent were independent. Deviations from these lines highlight where specific demographic groups are disproportionately targeted.
Key Insights
-
Property Crime Dominance: Accounts for ~65% of all incidents, driven by theft-from-vehicle.
-
Violent Crime Demographics: Hispanic victims make up ~51% of violent crimes. While this seems high nationally, it tracks closely with LA's population (~48% Hispanic), indicating the trend is largely proportional to local demographics.
-
Age & Homeownership: Property crime victims skew White as age increases, correlating with higher homeownership rates in older demographics.
NIBRS-compliant LAPD records (2020-present). Data was aggregated to the 21-precinct level and normalized by square mileage to correct for the "large jurisdiction bias" that often skews heatmaps.
Sunburst Charts
break down the LAPD/UCR hierarchy (Crime Type > Subtype).
Dual-Axis Maps
contrast absolute volume vs. relative density.
Stacked Bars
reveal age-based demographic shifts that aggregate metrics hide.
Descent % of victims largely mirrors LA's population (~48% Hispanic), but deviations exist. Property theft appears tied to
neighborhood wealth
rather than victim profile, whereas violent crime clustering indicates systemic vulnerabilities in specific communities.